LUMet® : Laser Ultrasonic Sensor for In-Situ Metallurgical Microstructure Studies
|
 It is now possible to monitor metallic microstructures in real time, in-situ, and at high temperatures while conducting physical simulations on a Gleeble, thanks to laser-ultrasonics.
 |
Laser-ultrasonics is a technology that enables non-contact ultrasonic measurements, using lasers to generate and detect ultrasound pulses. Unlike other ultrasonic technologies, it can be used on hot materials up to any temperature because there is no physical contact. Therefore, it is ideally suited for in-situ studies of solid metallic or ceramic materials up to their melting point. 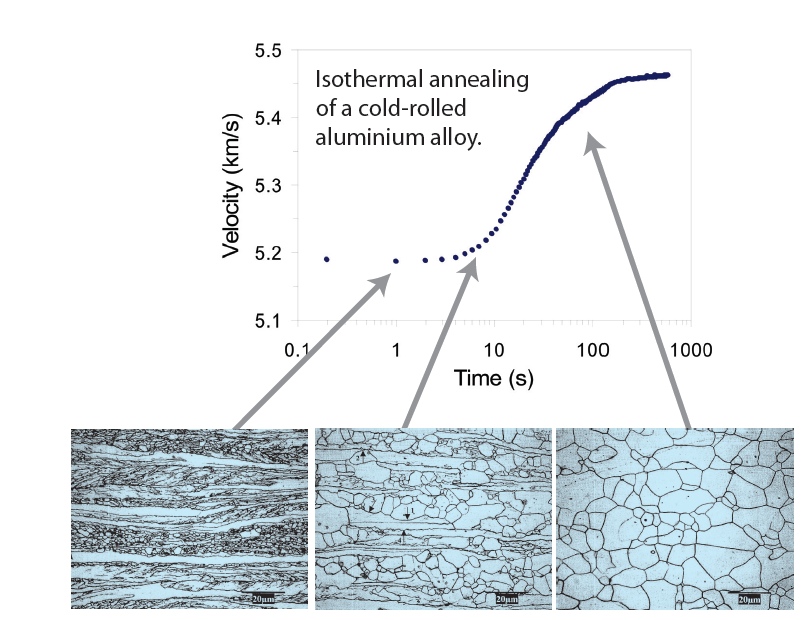
This paper describes: 1) Laser-ultrasound, LUMet technology, and how it works to generate and detect ultrasound
1) Laser-Ultrasound Technology
Laser-generation and laser-detection of ultrasound Laser-ultrasonic technology uses lasers to generate and detect ultrasound pulses in materials. To generate a sound pulse, it is necessary to use a short-pulse, high-energy laser. A Q-switched, Nd:YAG laser is often used for that purpose. These lasers radiate in the near infrared at a wavelength of 1064 nm. Each light pulse lasts typically between 5 and 10 ns and contains a few hundred mJ of energy. When such a light pulse hits the surface of a metallic object, most of it is reflected (metals reflect infrared radiation) but a small fraction, typically several percent, is absorbed within the penetration depth of the material. This penetration depth is of the order of 10 nm in metals. The metallic surface is instantaneously put into a state of extremely high temperature and pressure and a small amount of material is vaporized and heated into plasma. As a result, the intense surface pressure launches an acoustic pressure pulse inside the metal. The amount of material which is removed by this vaporization process is only of the order of 10 nm thickness, thus very hard to measure unless hundreds or thousands of pulses are used. In addition, it is possible to increase or decrease the amount of material ablated by changing the energy per unit area of the generation laser pulse. To detect laser-generated ultrasound pulses, or any other ultrasonic signals, a laser interferometer is used. It can sense the minute displacements that occur at the surface when an acoustic wave or pulse reaches the surface. As with any interferometer, this is done by illuminating with a laser the surface where we wish to detect ultrasound. Some of the reflected light is collected and made to interfere with a reference laser beam. The interfering light is transformed into a varying voltage by a photodetector. This voltage is proportional to surface displacement and thus accurately reproduces the ultrasound pulse.
Laser-ultrasonic sound pulses contain frequencies from a fraction of 1 MHz up to hundreds of MHz. Therefore, laser-ultrasonic interferometers must be very fast. Also, signal-to-noise ratio increases with the amount of light collected in the interferometer and can work on any type of surface (diffusive, anodized, oxidized, or other), not just mirror-like surfaces. Laser-ultrasonic interferometers utilize a detection laser capable of delivering very high laser power for a time duration equal to or longer than the ultrasonic experiment. A modern detection laser typically delivers 1 kW of light power for 50 μs. However, when we compare this to the generation laser (200 mJ in 10 ns, or 20 MW) this corresponds to only 50 mJ of energy over a very long time. Therefore, the small fraction of the detection laser light energy that is absorbed has time to diffuse into the metal and there is no ablation.
With today’s lasers, both the generation laser and the detection laser interferometer can fire at a repetition rate of up to 100 Hz. This allows for the potential to take up to 100 ultrasonic measurements per second.
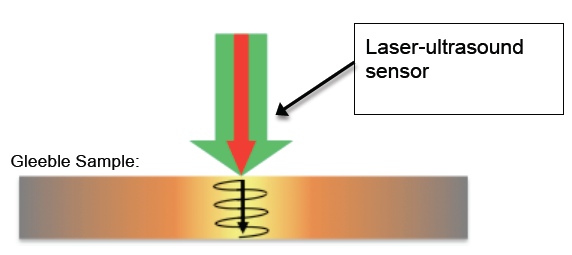 Figure 1: Schematic of the measurement principle.
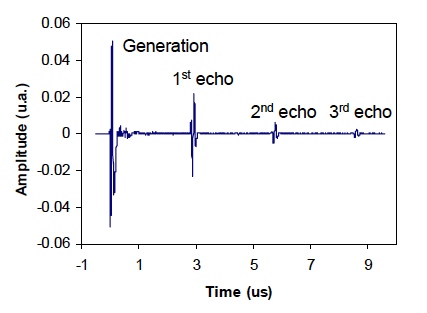 Figure 2. Example of laser-ultrasonic measurement of a single ultrasound pulse bouncing back and forth between the two faces of an 8 mm thick steel plate at 1100 °C inside a Gleeble 3500. Description of LUMet hardware Although infrared Nd:YAG lasers are commonly used to generate ultrasound, the LUMet utilizes a frequency-doubled Nd:YAG laser. The light pulse has a wavelength of 532 nm which makes it visible and green. Using a green laser is advantageous because metals absorb somewhat more at this wavelength than in the infrared. The result is more efficient ultrasound generation. An additional advantage of using green light is that less material is removed with each laser pulse. The LUMet laser interferometer utilizes a Nd:YAG laser working at its infrared wavelength of 1064 nm. It has a pulse duration of 50 μs and a peak power of 1 kW. The interferometer itself is based on photorefractive technology. The detection laser radiation is separated into two beams. One beam is the reference and the other one probes the surface of the sample located inside the Gleeble 3500. The reflected light is collected and made to interfere inside a photorefractive crystal. This creates a hologram of the sample surface. Any surface displacement is immediately sensed by this hologram and transformed into an electronic signal by very fast photodetectors. The electronic signal is then digitized and further processed numerically or displayed on a computer.
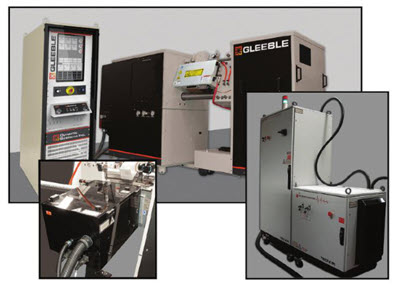
The generation laser and all the necessary optics are housed in an eye-safe enclosure attached to the back side of the Gleeble. The detection laser interferometer and all electronics are located remotely. The detection laser radiation is brought to the eye-safe enclosure via optical fibers. Therefore, ultrasound generation and detection is done on the back side of the sample, leaving free access to the front of the Gleeble and to the sample. It is also possible to locate the detection system on the front side, should this be necessary.
2) Ultrasonic Characterization of Materials
Laser ultrasonics, and ultrasonics in general, are technologies that allow measuring ultrasound velocity and attenuation. Ultrasound velocity is a direct measurement of elastic moduli, which are themselves influenced by temperature, alloying, phase transformations, texture, precipitation, and internal friction. Attenuation is caused by scattering by the microstructure (i.e. by the grains) and by internal friction. Consequently, ultrasonics can characterize all of these materials’ features. Clearly, the potential for metallurgical engineering applications is nearly unlimited, but also requires careful data interpretation. This section describes the principles of ultrasonic characterization of materials.
Velocity and elastic moduli The simplest method to measure ultrasound velocity is to measure the arrival times of two successive echoes bouncing between two parallel surfaces. The velocity, v, is equal to twice the thickness, h, divided by the time difference between the two echoes, Δt.
v = 2h / Δt
With LUMet, the time delay is accurately determined with digital autocorrelation techniques. As a result, velocity measurements are usually accurate (i.e. free of systematic errors), to better than ±1% and precise (repeatable in a given setup) up to ±0.01%. Precision is the ability to measure small changes in velocity. Precision is extremely high because it depends on the precision of the time delay measurement between the two echoes. Accuracy, on the other hand, depends on the accuracy of the measurement of sample thickness, h, and on acoustic diffraction effects. A higher accuracy, of up to about 0.1%, is possible if some precautions are taken.
Velocity is straightforwardly related to elastic moduli, M, and density, ρ, through
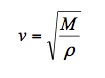 Clearly, if a material’s density is known or can be measured, velocity measurements are a direct measurement of elastic moduli. Therefore, elastic moduli can be measured with accuracy better than ±2% and a precision of ±0.02% (i.e. to half the precision and accuracy of velocity measurements). This is far superior to what mechanical tests can provide. In fact, ultrasonics is simply the best method to measure elastic moduli. Which modulus is measured depends on which type of ultrasonic pulse is propagated. For a shear wave, M is the shear modulus. For a compression wave traveling in the thickness direction (often denoted the “3” direction) of a plate, M is c33, one component of the elastic stiffness tensor. If we assume that the elastic properties are isotropic, an approximation that is often made in engineering, then these two measurements can be converted to Young’s modulus and Poisson’s ratio or to bulk compressibility and shear modulus. Figure 3 shows an example of measured elastic moduli obtained by laser-ultrasonics.
Elastic moduli and texture
At the level of 1%, the elastic properties are rarely isotropic (the same in all directions) and one can easily measure sound velocity variations with propagation direction. Usually, the reason for this is crystallographic texture. Single crystals have anisotropic elastic constants and sound velocities. For example, the (longitudinal) sound velocity in iron is 5488 m/s in the <100> direction, 6225 m/s in the <110> direction, and 6453 m/s in the <111> direction. Texture is the preferential alignment of the crystallographic axes of grains in some directions. Clearly, if texture is such that the <111> directions of the single crystals align in the direction normal to the surface, the sound velocity will be higher in that direction than if there were no alignment (a random texture). A measurement precision and accuracy of 0.01-1% means that texture differences can be picked up easily, even in production material that is supposed to be manufactured with high uniformity and reproducibility.
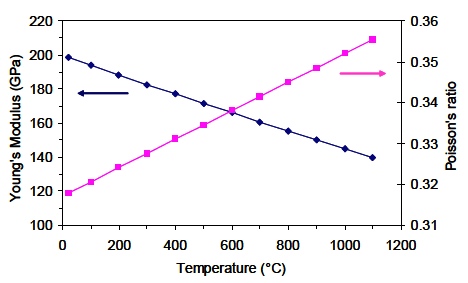 Figure 3. Young’s modulus and Poisson’s ratio of stainless steel as a function of temperature measured by ultrasound with LUMet. [1] This simple example of iron illustrates how texture affects velocity. It is also possible to obtain some texture coefficients (also called ODCs for Orientation Distribution Coefficients), i.e. a quantitative assessment of the crystallographic orientation distribution, from ultrasonic velocity measurements. Unlike x-ray measurements, which provide texture information at the sample’s surface, LUMet’s measurements average the texture throughout the entire sample thickness. This can be advantageous because it is the average bulk texture that determines the material’s bulk properties. Figure 4 shows a comparison of bulk texture measured by laser-ultrasonics and neutron diffraction in an aluminium alloy. Elastic moduli and other phenomena
Generally, any phenomenon that is known to affect elastic moduli can be sensed with ultrasonics. This includes phase transformations (bcc and fcc iron do not have the same elastic constants), the precipitation of solid solution elements during aging, and internal friction effects. Usually, these effects can be seen when texture is known to not vary. Figure 5 shows the measured ultrasonic velocity change during austenite to ferrite transformation in steel. 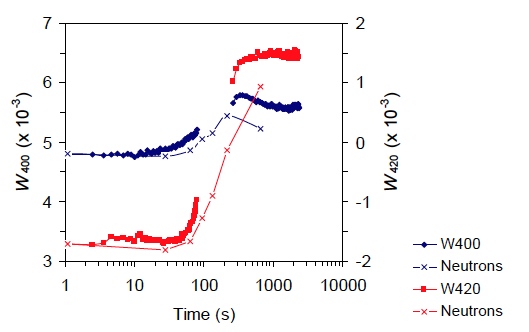 Figure 4. Evolution of two texture coefficients (ODCs) during the isothermal annealing of the aluminium alloy 5754 at 325 °C. Solid symbols: Measurements with NRC’s LUMet. X symbols and line: Neutron diffraction measurements on quenched samples. [2] 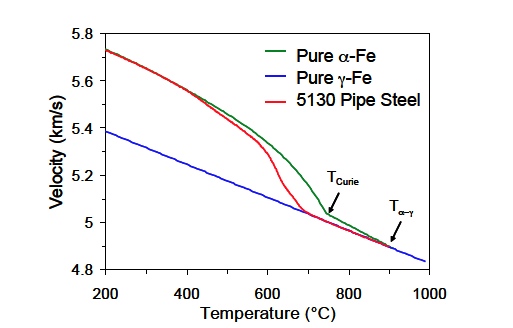 Figure 5. Blue: Ultrasound velocity in austenite. Green: Ultrasound velocity in ferrite. Red: Ultrasound velocity in 5130 pipe steel during cooling. As it cools, the 5130 steel transforms from austenite to ferrite and the sound velocity reflects that transformation. Note also the kink in the velocity of ferrite at the Curie temperature of the magnetic phase transformation. [3] Attenuation and grain size Just as velocity is measured by taking the time of arrival of two successive echoes bouncing between two parallel surfaces, the simplest way to measure attenuation is to take the amplitude ratio of successive echoes. However, although the sound velocity is nearly frequency-independent, attenuation is not. Therefore the amplitude ratio is calculated for each frequency component of the ultrasound pulse. If A1(f) and A2(f) are the amplitudes of the first and second echoes as a function of frequency, f, then the frequency-dependent attenuation, α(f) in units of dB per unit distance is given by: 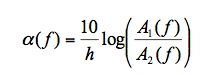 Ultrasonic diffraction contributes to attenuation but there exist simple setups where diffraction has either zero contribution or a known contribution that can be removed from the data.
In most cases, the main cause of attenuation is scattering by grains. The larger the grains are, the larger the amount of scattering and the larger the attenuation. This leads to a simple method to measure grain size as shown in Figure 6.
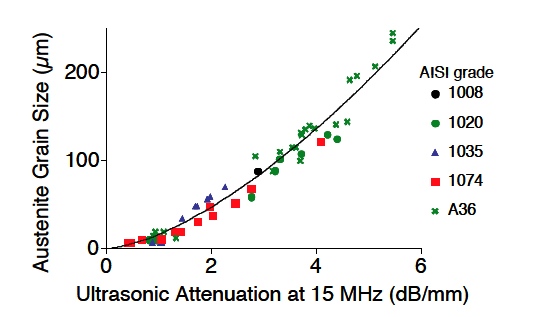 Figure 6. Austenite grain size vs. ultrasonic attenuation at 15 MHz in austenitic steel at 1100 °C. The ultrasonic measurements were obtained in-situ, inside the Gleeble using a NRC’s LUMet. Austenite grain size was obtained by standard metallographic techniques on quenched samples. [4]
Attenuation and other phenomena
When grain size is very small, or for some materials where grain scattering is weak (like aluminium), attenuation may be attributed in large part to internal friction phenomena. Examples of internal friction phenomena that have been measured with laser-ultrasonics include dislocation motion, Snoek relaxation, and magnetoelastic relaxation. 3) Laser-Ultrasonic, In-Situ Characterization of Metallurgical Processes
One of the advantages of laser ultrasonics is that no contact is required with the part or sample being measured. Another advantage is the speed at which measurements can be made, up to 100 times per second. The two advantages combine to enable an ideal sensing technology for in-situ characterization of metallurgical processes, up to the melting temperature of materials. When combined with the Gleeble 3500, the industry leading thermomechanical simulator for metallurgical processes, the LUMet sensor can provide detailed information about process kinetics. Following are some examples.
Recrystallization of aluminium alloys When a cold rolled material such as aluminium recrystallizes, there is usually a change in crystallographic texture. This texture change causes a change of ultrasound velocity. By monitoring the velocity change from the initial, cold-rolled value to the final, annealed value, one can estimate the recrystallized fraction, as illustrated in Figure 7. It must be noted that each metallurgical data point must be made by interrupting the process on a sample, quenching it, and doing standard metallographic examination, which can take days. In contrast, LUMet yields the entire curve in a single experiment, and the curve is much more detailed. Austenite decomposition In Figure 5, it was shown how the ultrasound velocity varies from the austenitic value to the ferritic (or pearlitic) value during cooling of 5130 steel pipes. This grade of steel is a 0.3% carbon, 0.8% manganese steel with an addition of 1% chromium. It turns out that the fractional change in velocity at a given temperature is a measure of the fraction of austenite that has decomposed into ferrite, pearlite, martensite, or other microstructures. LUMet’s measurements agree well with dilatometric measurements made on a dedicated dilatometer. However, unlike other dilatometers designed for the Gleeble, LUMet’s measurements are not affected by stresses and strains caused by thermal gradients inside the sample, and appear to be less affected by carbon content. This results into more accurate measurement of phase transformations, and can be a very useful tool to investigate austenite fractions at high temperature in advanced steels, like TRIP steels.
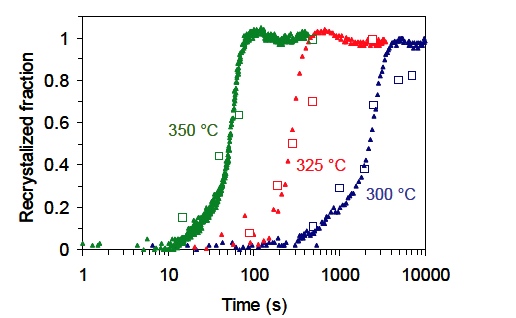 Figure 7. Recrystallized fraction of AA5754 as a function of time during isothermal annealing. Triangles: measured with NRC’s LUMet. Squares: measured by metallography on quenched samples. [5] 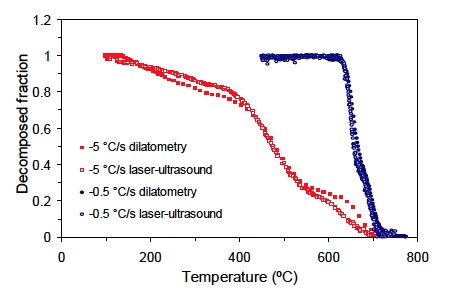 Figure 8. Fraction of austenite that decomposes into ferrite and other microstructures during cooling of 5130 steel. Full symbols: dilatometric measurements in a dedicated dilatometer. Open symbols: measurement obtained with NRC’s LUMet. [6]
Recrystallization and grain growth of steel transfer bars
Steel transfer bars result from processing thick slabs through the hot-rolling, roughing mill. They are sent next to the hot-rolling, finishing mill where they will become plates with the desired thickness and microstructure. To control the microstructure and mechanical properties of the finished plates, it is important to understand and control how quickly steel recrystallizes after hot deformation, and how quickly the grains grow following recrystallization. This information is important because one would like to know if the effect of successive processing steps is cumulative or not. If the microstructure has time to fully recover between processing steps, then there will be no cumulative effect. This metallurgical process was simulated as follows. Cylindrical samples of complex phase steel were soaked for 2 minutes at 1250 °C then cooled to a deformation temperatures of 1000, 1050, and 1100 °C. They were allowed to thermally equilibrate at that temperature. Then they were given a compressive strain of 0.3 at a strain rate of 1 s-1, the LUMet sensor was turned on as soon as the deformation ended and grain size was monitored as a function of time (Figure 9). As the deformed microstructure begins to recrystallize, the average grain size diminishes. The point of minimum grain size corresponds to full recrystallization. Following this point, grain size begins to increase due to grain growth. Clearly, the kinetics occurs much faster at higher temperatures.
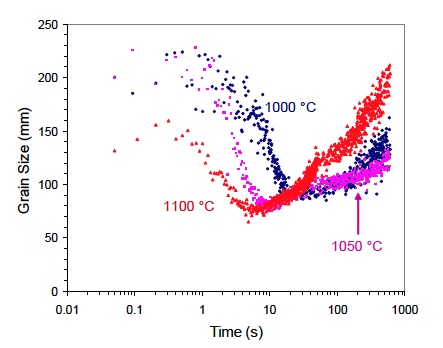 Figure 9. Grain size as a function of time in CP steel immediately following hot deformation. Full recrystallization corresponds to the point of smallest grain size. Grain growth is seen to occur thereafter. [7]
Such a study would have been very difficult to do with standard metallurgical methods on quenched samples. First, it would have been essentially impossible to measure at the earliest times, from 0.1 to a few seconds. Second, prior austenite grain size is extremely difficult to measure on this alloy. And finally, a study on a few quenched samples would not have provided such precise details as a function of time.
Concluding Remarks
Ultrasonics is a versatile probe of microstructure. It can measure elastic moduli with extremely high precision, sense the relative fraction of two phases, provide some measure of crystallographic texture, including some texture coefficients, measure mean grain size, and even sense dislocations and interstitials. When these microstructural parameters vary because of thermomechanical processing, ultrasonics can sense phase transformations, recrystallization, and grain growth.
The LUMet system brings ultrasonics to the Gleeble. It enables in-situ and non-contact ultrasonic measurements during thermomechanical processing using the Gleeble. LUMet technology has been proven to have the capability to characterize most processes with excellent accuracy. LUMet is fast and can save a lot of time in metallographic laboratories. LUMet also enables studies that would be impossible to do any other way.
LUMet may ultimately prove to be just a stepping stone towards even higher goals. It is easy to imagine that once LUMet technology has revolutionized in-situ characterization of metallurgical processes, its adaptation will also revolutionize in-line process monitoring and control.
 For more information, please contact us at info@gleeble.com or +1 (518) 283-5350 |
|
|
Dynamic Systems Inc. continuously improves its products. Specifications at the time of order may be changed and not be as herein described. Specifications are subject to change without notice. Dynamic Systems Inc. reserves the right to make changes at any time in order to improve design and to supply the best product possible. Pictures and diagrams in all brochures and documents provided by Dynamic Systems Inc. show latest models as of time of publication. Actual appearance may vary slightly.
Information contained in this publication is believed to be reliable and accurate. However responsibility is not assumed for its use nor for any infringement of patents or rights of others that may result from their use. No license is granted by implication or otherwise under any patent or patent right of Dynamic Systems Inc. or others. Typographical errors subject to correction. “LUMet” is a trademark of Dynamic Systems Inc.
All other trademarks are the property of their respective trademark owners. Sources: [1] A. Moreau and S. E. Kruger. Accepted for publication in Proceedings of the 5th International Conference on Physical and Numerical Simulation of Materials Processing. Zhengzhou, China, 23-27 October 2007.
[2] A. Moreau and S. E. Kruger. Proc. of the 5th Internat. Conf. on Physical and Numerical Simulation of Materials Processing. Zhengzhou, China, 23-27 October 2007 [3] Materials Science & Engineering A Vol. 425 (2006) 238-243. [4] Scripta Materialia 39, 6 (1998) 735-741 & Scripta Materialia 42, 9 (2000) 867-874. [5] Materials Science Forum 426-432. (http://www.scientific.net). [6] CNRC-IMI, unpublished data. Similar work published in Materials Science & Engineering A Vol. 425 (2006) 238-243. [7] S. Sarkar, A. Moreau, M. Militzer, and W. J. Poole. Submitted to Materials Transactions A, 2007. Note that Figure 9 is the raw data. The Figures submitted for publication were smoothed to reduce noise on the vertical scale at the expense of a reduced resolution on the time scale. |